コンテンツへスキップ
トライフィールズ
データサイエンス – 統計解析・機械学習
メニュー
ホーム
サービス
事業概要
ブログ
サイトマップ
お問い合わせ
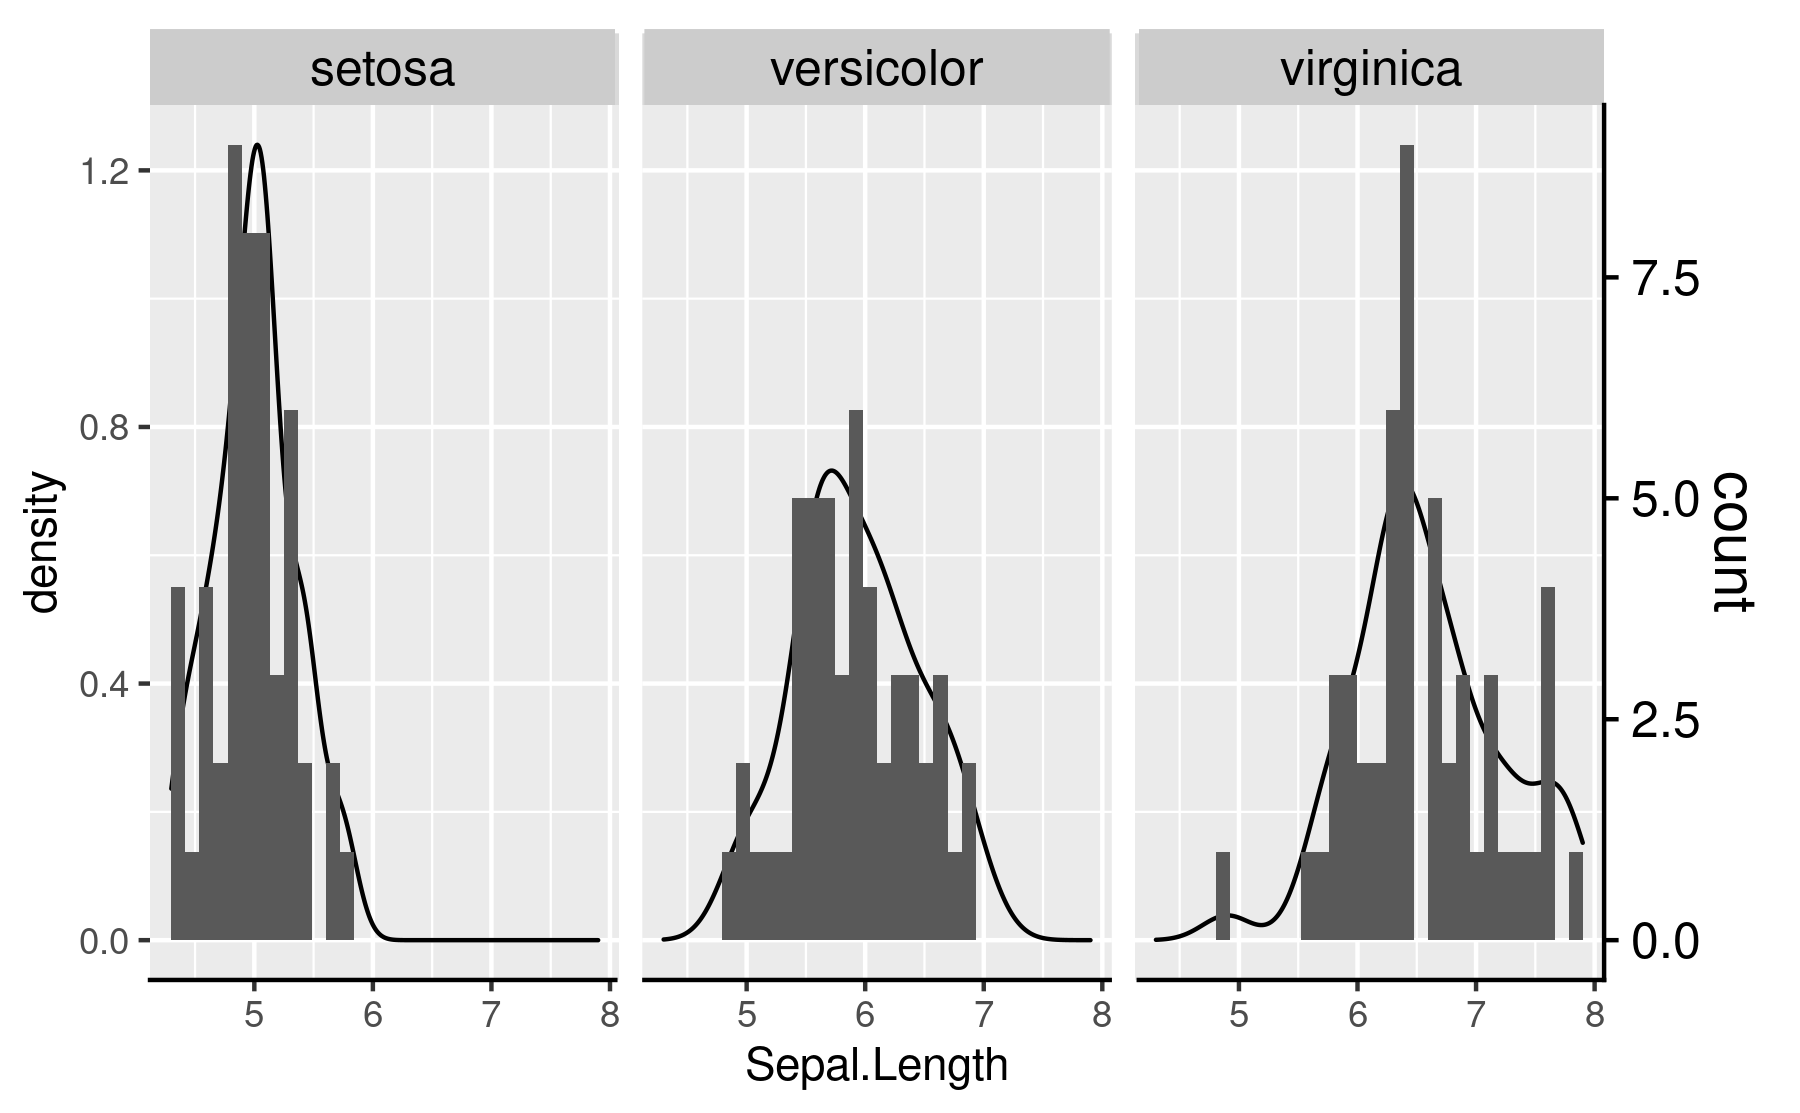
how-to-create-easily-a-2-axis-graph-using-ggplot2-in-r-01
how-to-create-easily-a-2-axis-graph-using-ggplot2-in-r-01
← 前へ
こちらもおすすめ
R K-means法のクラスタ数を機械的に決定する方法
R×conjoint コンジョイント分析の仕方
Journal of Machine Learning Research Papers: Volume 1の論文一覧